I recently developed a plugin called siyuan-dashboard for data statistics in Siyuan note taking and writing.
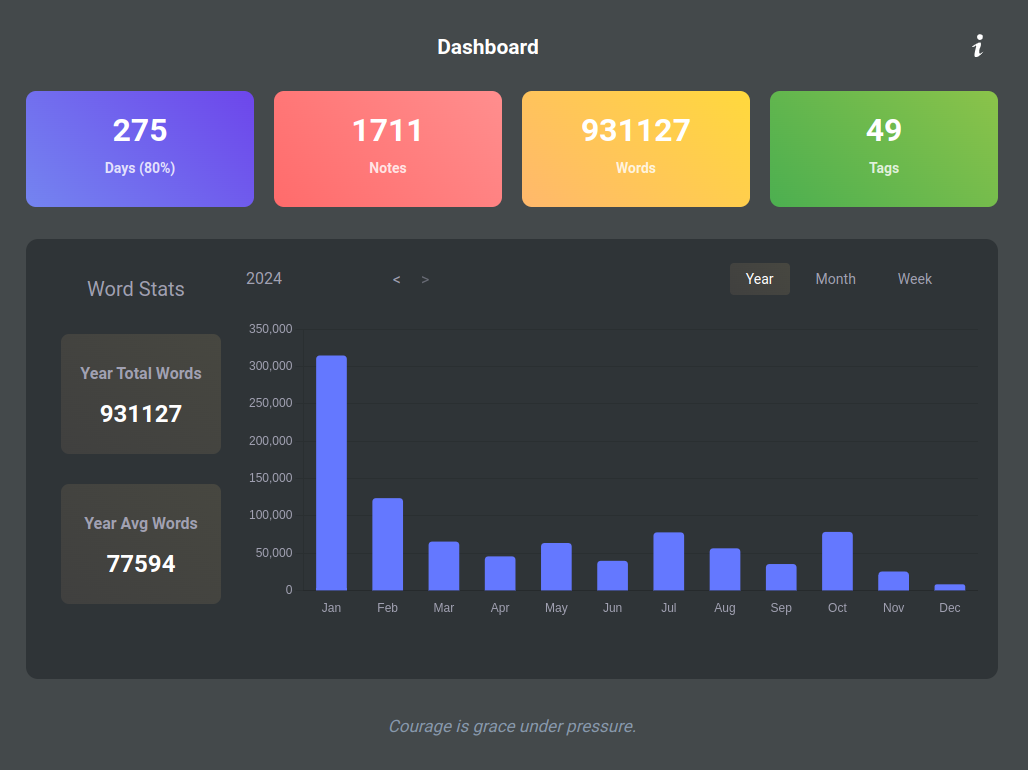
siyuan-dashboard, which can be translated as "Siyuan Dashboard", is a Siyuan Notes plugin, mainly used to display the statistics of Siyuan Notes. Take a look at the effect diagram:

Function introduction
Siyuan-dashboard is a data statistics plugin, and currently supports the following functions:
- Supports statistics of days, notes, words, and tags.
- Supports percentage display of usage days (actual usage days/total days).
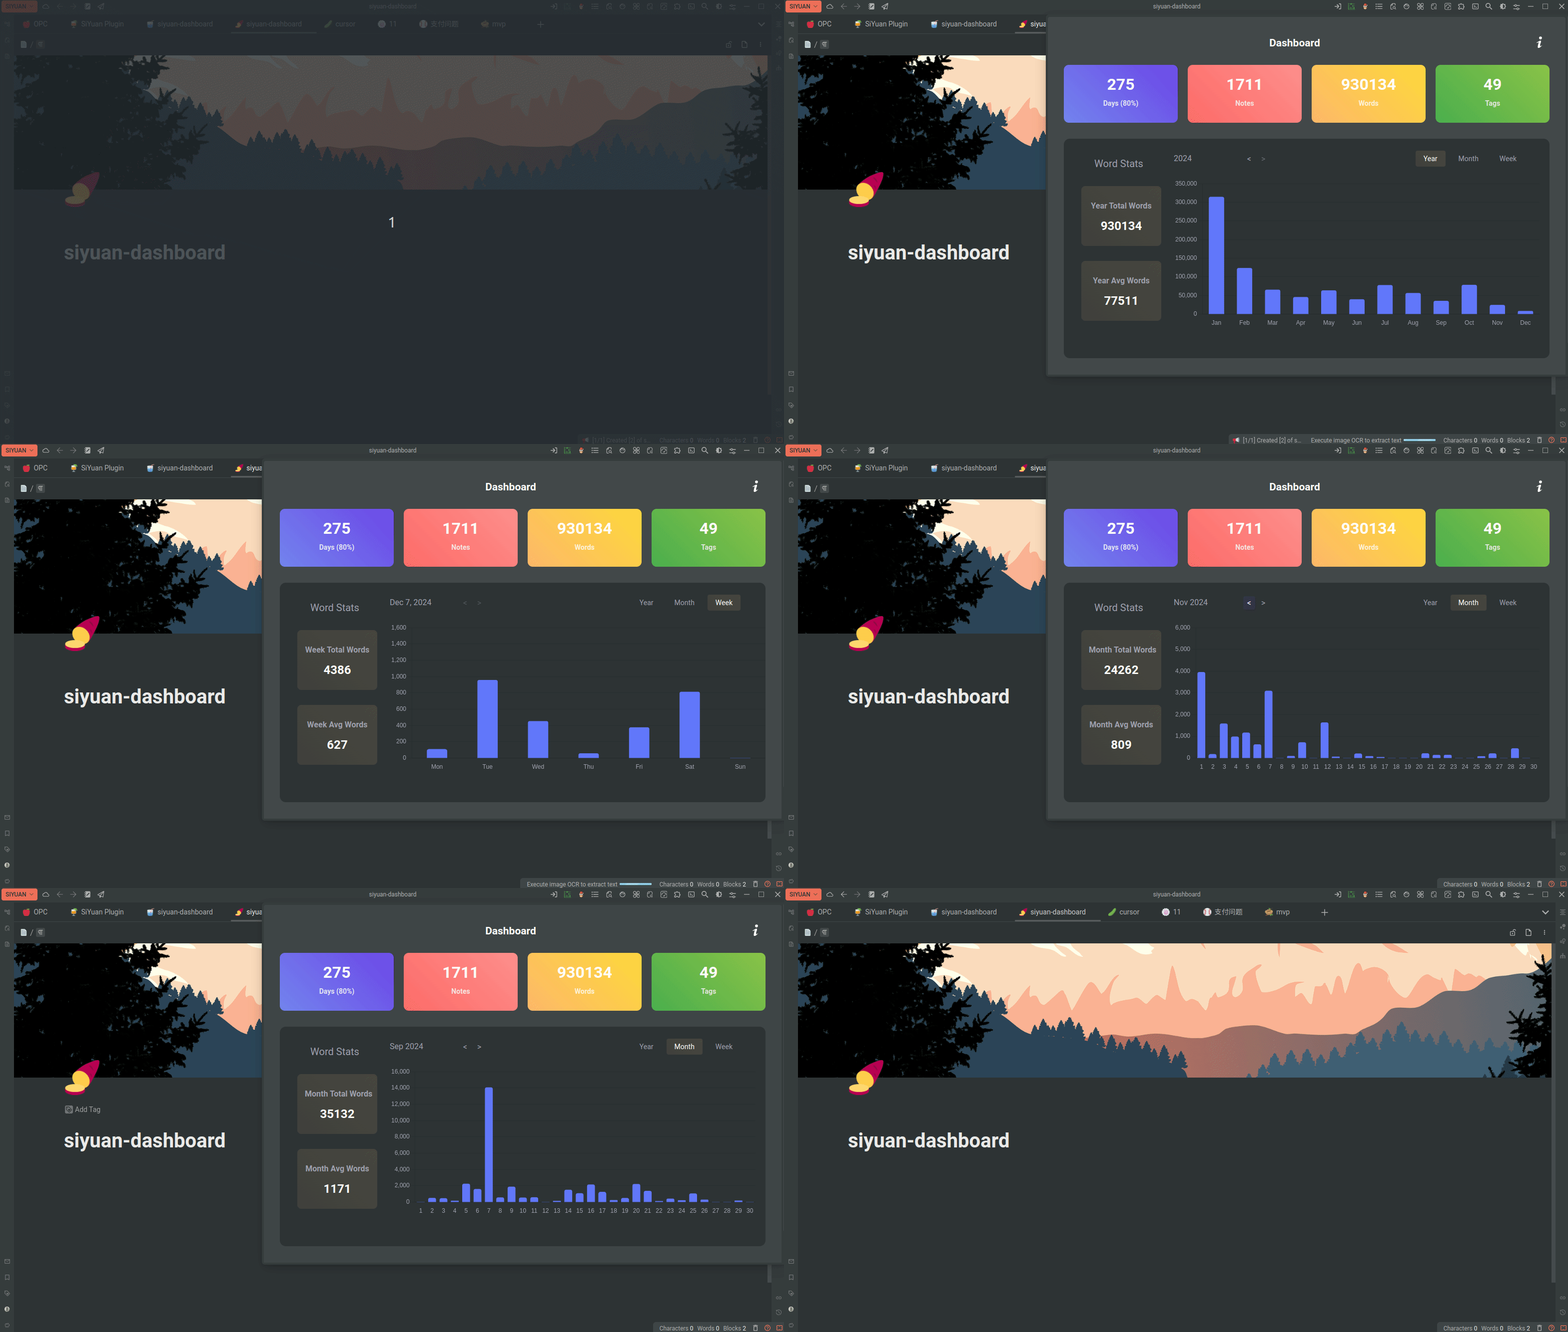
- Supports total word count and average word count statistics for years, months, and weeks.
- Supports switching between years and months to view historical data.
- Adapts to light and dark modes.
- Multi-language adaptation supports English.
Currently, it is mainly adapted to the desktop, and the mobile terminal is not adapted for the time being. If necessary, it will be adapted later.
Usage
Select the "Dashboard" icon in the top bar, and the statistics will be displayed in the upper right corner. Here is a demonstration:

Version History
v1.0.0
- Initial version, supports basic statistics functions.
v1.0.1
- Fixed the problem that the image in README is not displayed in the plugin store.
v1.1.0
- Multi-language adaptation supports English.
- Adjust the right margin of the icon.
- Adjust the spacing between the year, month, and day text in the chart.
v1.1.1
- Fixed the problem that the image in README is not displayed in the plugin store.
Feedback
If you encounter any problems during use, please raise issues on Github.
Support the author
If you approve of this project, please buy me a cup of coffee. This will encourage me to continue updating and create more useful tools~
Give a Github Star to support the author~
Contact me
- X(twitter):@Agrowlearner
- email:[email protected]
Welcome to here!
Here we can learn from each other how to use SiYuan, give feedback and suggestions, and build SiYuan together.
Signup About